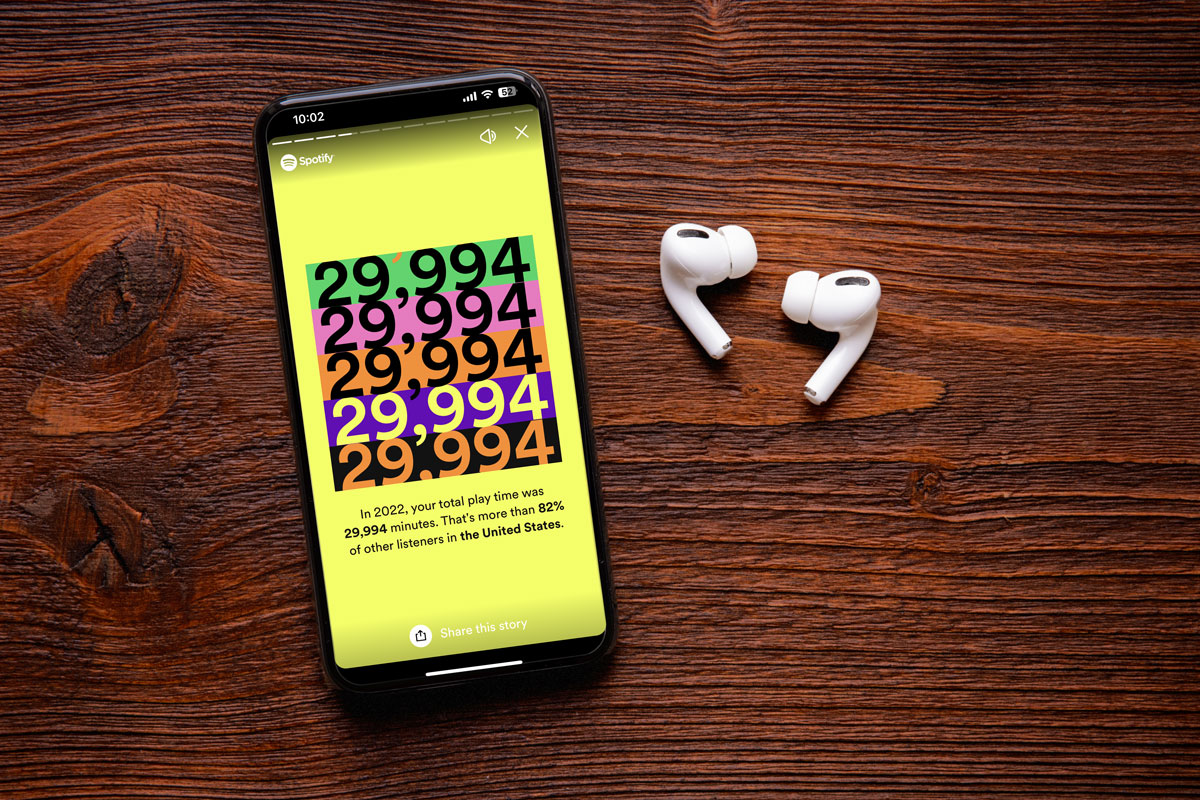
Turns out, I listened to 29,994 minutes of music on Spotify in 2022 — more than 82% of U.S. listeners — and checked out 672 artists across 54 genres.
Not gonna lie, that data from Spotify’s end-of-year Wrapped report makes this music fanatic feel a little cool, even if one of my top tunes was “The Chicken Wing Song” by Ricky Desktop, since one of my many curated playlists was created for my 6-year-old grandson. (You may be, regrettably, familiar with that little ditty — “Chicken wing, chicken wing, hotdogs and baloney, chicken and macaroni, chilling with my homies.”)
But hey, they can’t all be winners. Spotify’s Wrapped, on the other hand, has evolved into a perennial winner when it comes to using analytics in a way that captures users’ attention, gives them content that they love to talk about and share and, most importantly, does it in a way that feels interesting without being creepy.
Wrapped provides lots of lessons for all kind of companies — perhaps especially retailers, media and streaming services and hospitality businesses, but really for almost any organization. Here are a few insights into how Spotify makes metrics work for its users.
It’s all about you
As the saying goes, “Everyone’s the star of their own universe,” and boy does Spotify get this. Your story video opens with a “Wrapped 2022” screen and then gets right down to business making it all about you, with just enough context and comparison to the larger listening universe to keep it interesting.
“But enough about 2022, let’s talk about you,” the very next screen declares, over a background medley of songs from your year’s listening habits. With simple, punchy language threaded throughout the whole story, Wrapped keeps the focus on the user. This is an easy thing for any company to replicate, in a way that fits its own company personality, when sharing analytics with customers, but it’s often overlooked.
This personalization continues throughout your Wrapped story, which runs a little over three minutes. As it introduces how many music genres you explored, for example, Wrapped tells you, “You explored XX different genres. Look at you, you little astronaut,” with cool graphics in keeping with this year’s outer-space theme. And the personalized language continues throughout — simple, but effective.
It’s shareable
Spotify knocks it out of the park on shareability, a perfect way to build brand awareness and attract more users. According to technology news and analysis site TechCrunch, 120 million Spotify users accessed Wrapped in 2021, up from 30 million in 2017, and there were a whopping 60 million shares of Wrapped stories and cards (individual shareable components of the report) in 2021.
Part of the reason for that high percentage of shares is undoubtedly because the analytics are presented so well — it’s easily digestible, highly personal, interesting and fun content. But Spotify also takes pains to make it easy to interact.
There are “share” buttons peppered throughout Wrapped, giving you the option to easily share your whole report or just one of several variations of a top artists/top songs snapshot. On the cards that elaborate on your top artist and top podcast, there’s a “Say Thanks” button that generates a tweet with personal metrics. For me, it’s “Thanks Cautious Clay for spending 349 minutes with me in 2022. I couldn’t stop listening to Cold War.”
While Wrapped has always been shareable on social media apps, Spotify has doubled down on shareability. According to Spotify and various media outlets, there is now Wrapped-themed Bitmoji apparel for Snapchat users, as well as Wrapped-themed GIFs through a GIPHY partnership. Wrapped 2022 added sharing options that are a bit more private through integrations with WhatsApp, Instagram Direct Messages, Facebook Messenger and Line.
It’s fun and interesting
Not every company or organization can or should make their analytics reporting fun. Most people don’t want a lot of razzle-dazzle when presented with their metrics from their financial institution or their health care provider, after all. But at a minimum, any company sharing metrics with customers or users should make it interesting.
Spotify manages to do both. Smartly designed and snappily written, Wrapped is colorful and clever. It doesn’t hurt that the whole Wrapped report is presented against a backdrop of songs that Spotify already knows you like — or have at least checked out. Even there, they overdeliver. I’ve viewed my report a dozen times, and each time the medley features new songs.
Overdelivering is a hallmark not just of Wrapped but of any analytics reporting. What else can you give your customers — interesting stats, useful tools, relevant background or targeted recommendations, among others? Wrapped, for example, creates a playlist of your 100 top songs of the year and downloads it to your account at the tap of a button.
Play on
When the metrics you’re collecting have to do with a customer’s listening, reading or buying habits, you may have a slight advantage when it comes to hitting it out of the park. Still, too many companies fall short. Spotify’s Wrapped provides plenty of great lessons on how to engage customers — not just when reporting analytics, but in any communications — so they’ll listen.